Our Vision
To make Earth-observation data more accessible and understandable, transforming observations into knowledge for a better-informed and more sustainable future.

Earth Observation Data Platform
Explore, download, visualize, and process Earth data on the atmosphere, climate, land, and ocean.

To make Earth-observation data more accessible and understandable, transforming observations into knowledge for a better-informed and more sustainable future.
Developing accessible interfaces and data-analysis tools that empower researchers, stakeholders, and the public to discover, explore, visualize, and analyze Earth-observation data.
We will tap into the Earth science community's end-to-end capability as an open enterprise to incorporate innovation, scientific discovery, and emerging user needs to accelerate the use of Earth science and inform the next iteration of programs, missions, and initiatives.

What comes back out — and the needs that set the next iteration.
Findings and tools shaped for the people who act on them.
Retrievals, comparisons and statistics that turn a granule into a measurement.
The archives themselves: what the instruments recorded, from space, air and ground.
User needs inform the next iteration of programs and missions.
RASAD is built to carry Earth-observation missions from more than one programme — the same search, the same figures, whichever agency flew the instrument.

The European Space Agency flies Earth Explorers to answer one scientific question each, and the Copernicus Sentinels to keep an operational watch on the planet. Between them they cover cloud and aerosol, wind, gravity, soil moisture, ice thickness, forest carbon and atmospheric composition.

NASA's Earth science fleet has been recording the planet continuously since the 1990s, from Terra and Aqua through GPM, OCO, ICESat-2 and PACE. Its long, calibrated records are what make a single overpass legible as part of a trend.
What each spacecraft measures, the orbit it flies, and where it stands on the platform. The missions still ahead are listed in the order they are being brought on.

Cloud, aerosol and radiation, profiled in one column of air.

TROPOMI — trace gases over the whole globe, every day.

Air quality over Europe, hour by hour, from geostationary orbit.

Aerosol, surface temperature and colour along a wide swath.

Wind profiles from a Doppler lidar, pole to pole.
NASA's Eyes on the Earth, running inside this page — every Earth-observing spacecraft where it is at this moment.
Connecting to NASA Eyes on the Earth
NASA's viewer is not answering. Open it in a new tab below.
Straight from NASA's Earth Observatory and ESA's Observing the Earth newsroom.
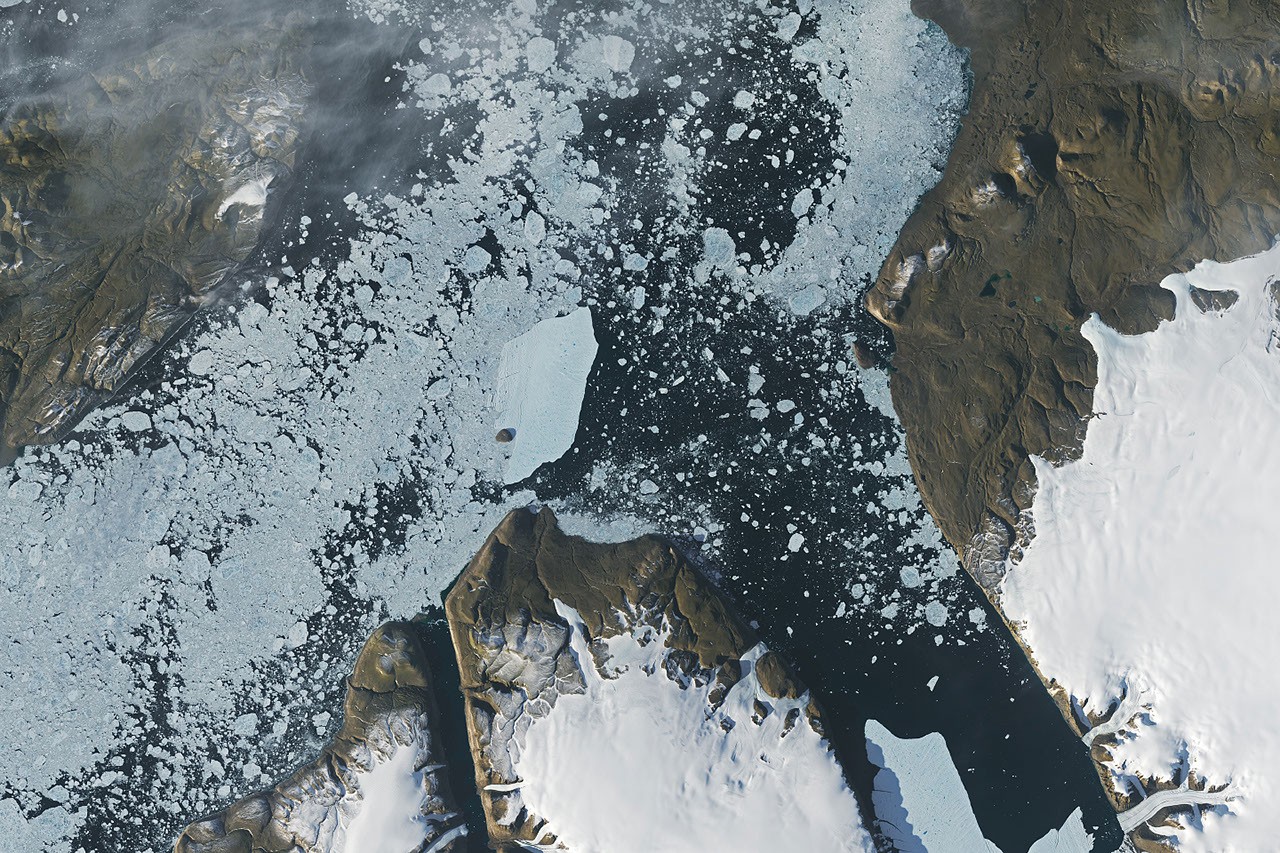
In summer 2026, a substantial iceberg calved from Petermann Glacier in northwest Greenland and swiftly drifted into Nares Strait, colliding with an island along the way.
Video: 00:01:00 Using cutting-edge technology, ESA’s FLEX mission is designed to reveal new insights into how plants function by measuring the faint fluorescence they emit when they capture…
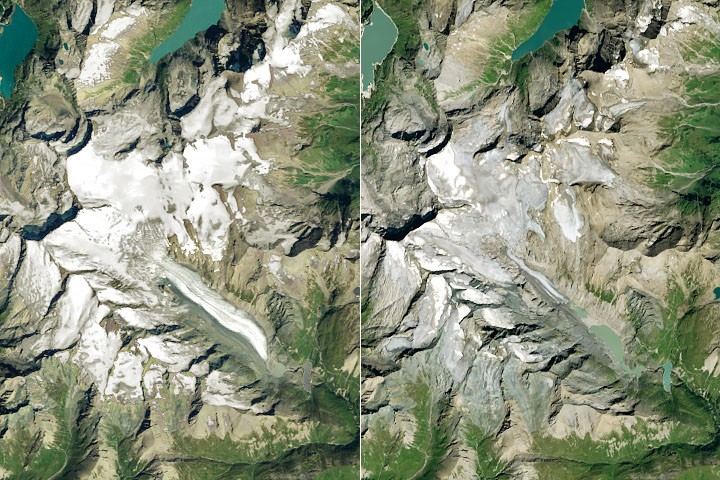
One narrowing icefall remains the linchpin for the Alpine glacier—and it may not be long for this world.
With thousands of emergency responders conducting search-and-rescue operations following the catastrophic flash flood that struck northern Nepal on 26 August, satellite imagery is helping…
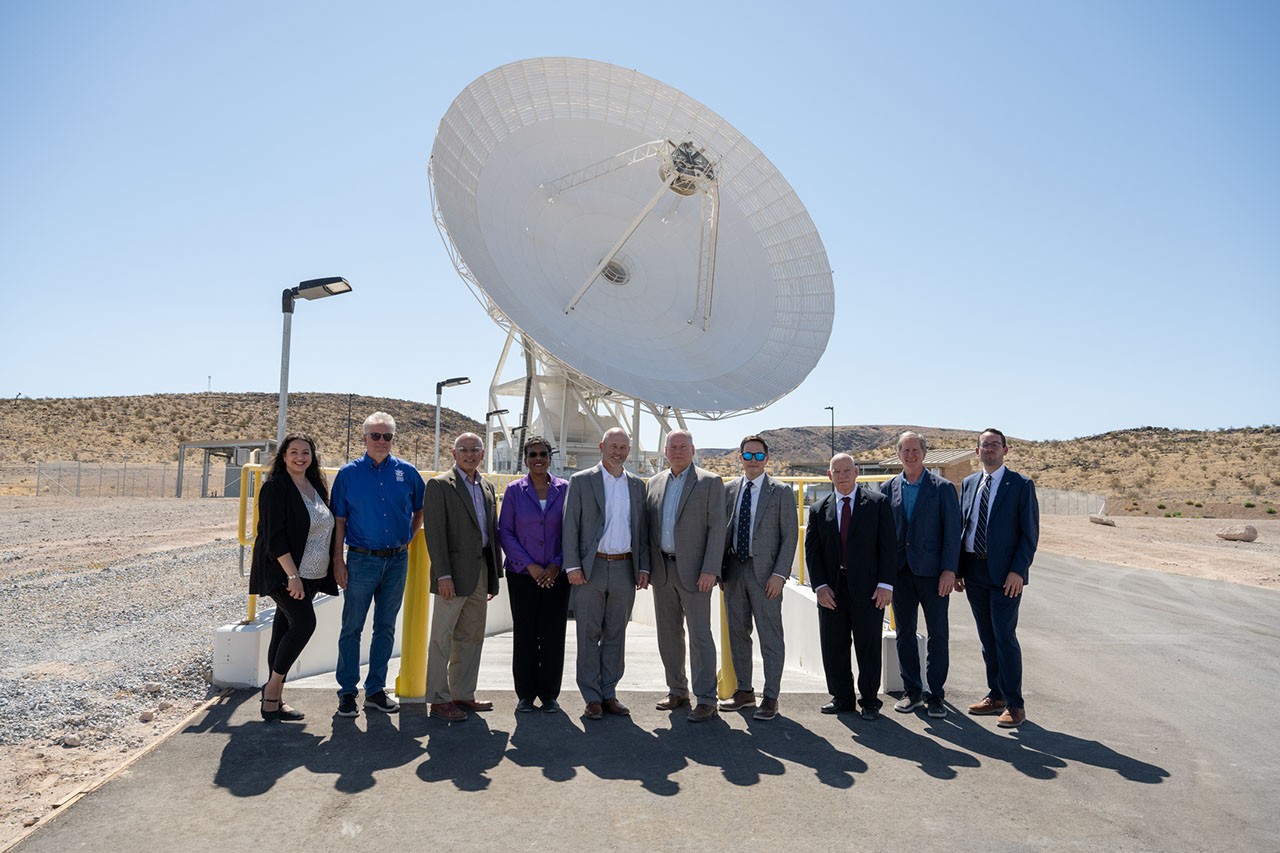
Description Leadership from NASA Headquarters, the Jet Propulsion Laboratory, and the Deep Space Network (DSN) stand in front of the recently completed Deep Space Station 23 antenna at the…
Image: Fuelling Sentinel-3C
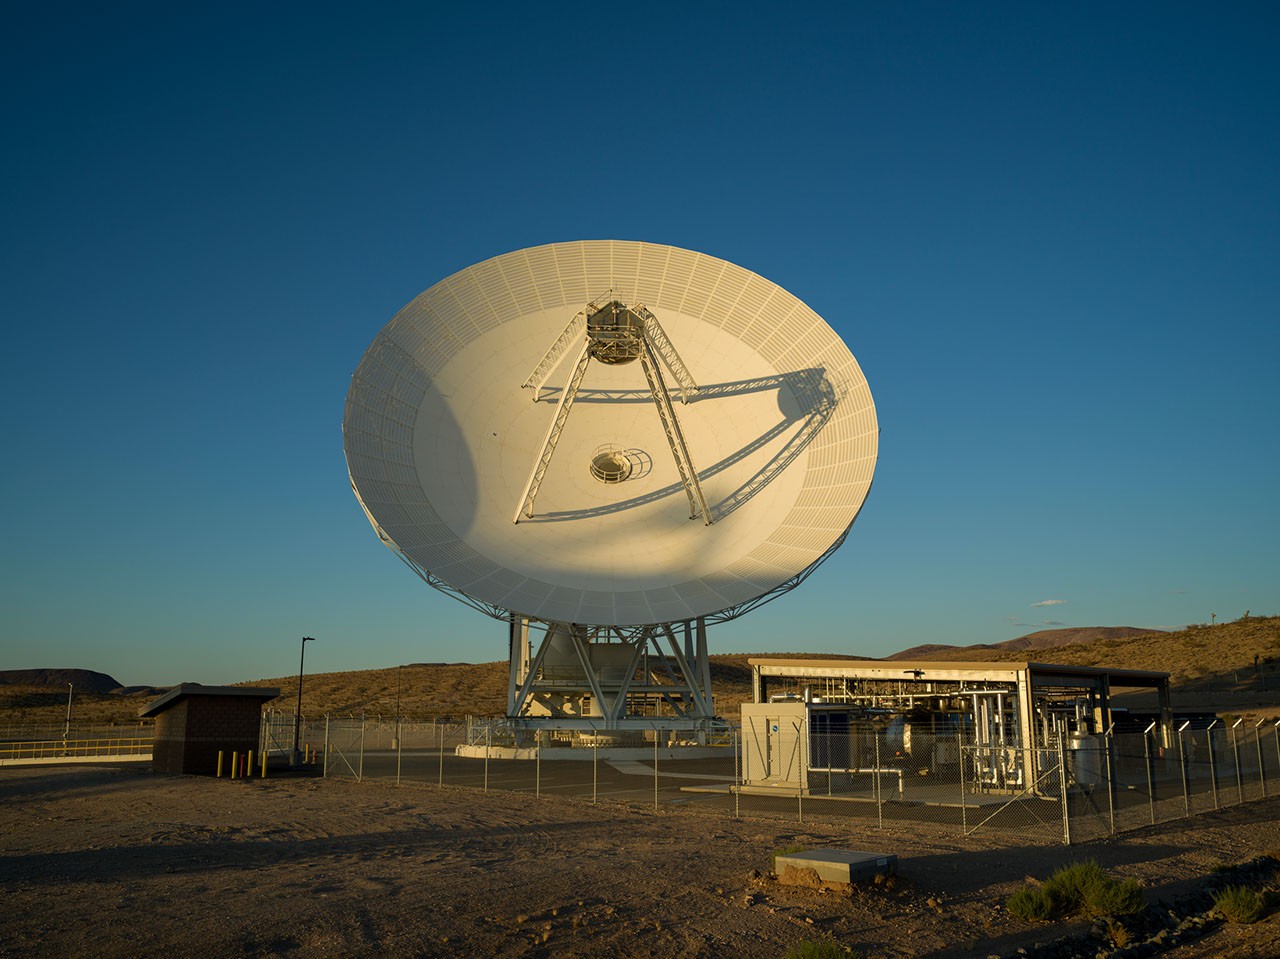
Description Long shadows are cast by the recently completed Deep Space Station 23 at the Deep Space Network’s Goldstone complex near Barstow, California, in August 2026. A 34-meter…
Video: 00:04:28 The Meteosat Third Generation -Imager2 (MTG-I2) satellite, has been launched on board an Ariane 6 launcher from Europe’s Spaceport in French Guiana. Liftoff was on 27 August…
Everything between the search and the paper happens here — no reader to write, no colour scale to look up, nothing to install.

Rendered by the platform — geolocation, local solar time and the ground already in place, at the colour convention the product expects.

Point, radius and window — orbit, frame and baseline resolve themselves.

Each granule drawn to its own convention, one click after landing.

Low, medium and native grids, switched without re-downloading.

One click on the track, with the spread of its neighbours behind it.

Between any two points of the pass, mapped and tabulated.

A station file and the overpass on one figure, matched in space and time.

A scene that falls on a boundary is still one continuous curtain.

PNG for the paper, Excel for everything after it.
Pick the place and the window that matter to you.
Collection, baseline and frame resolve themselves.
Geolocated, ground-referenced, ready for the paper.
Granules land once and are shared between accounts — your quota counts only what is actually yours.
Every pass recorded over your region is one search away.
Start exploring Already have an account? That button signs you in. Create one if you don't — an administrator approves it first.